Skip to content

Policy KPI Dashboard

Gain Actionable Insights into Your Book of Business

Request a Demo

50% More KPIs Than Your Traditional Reporting Tools

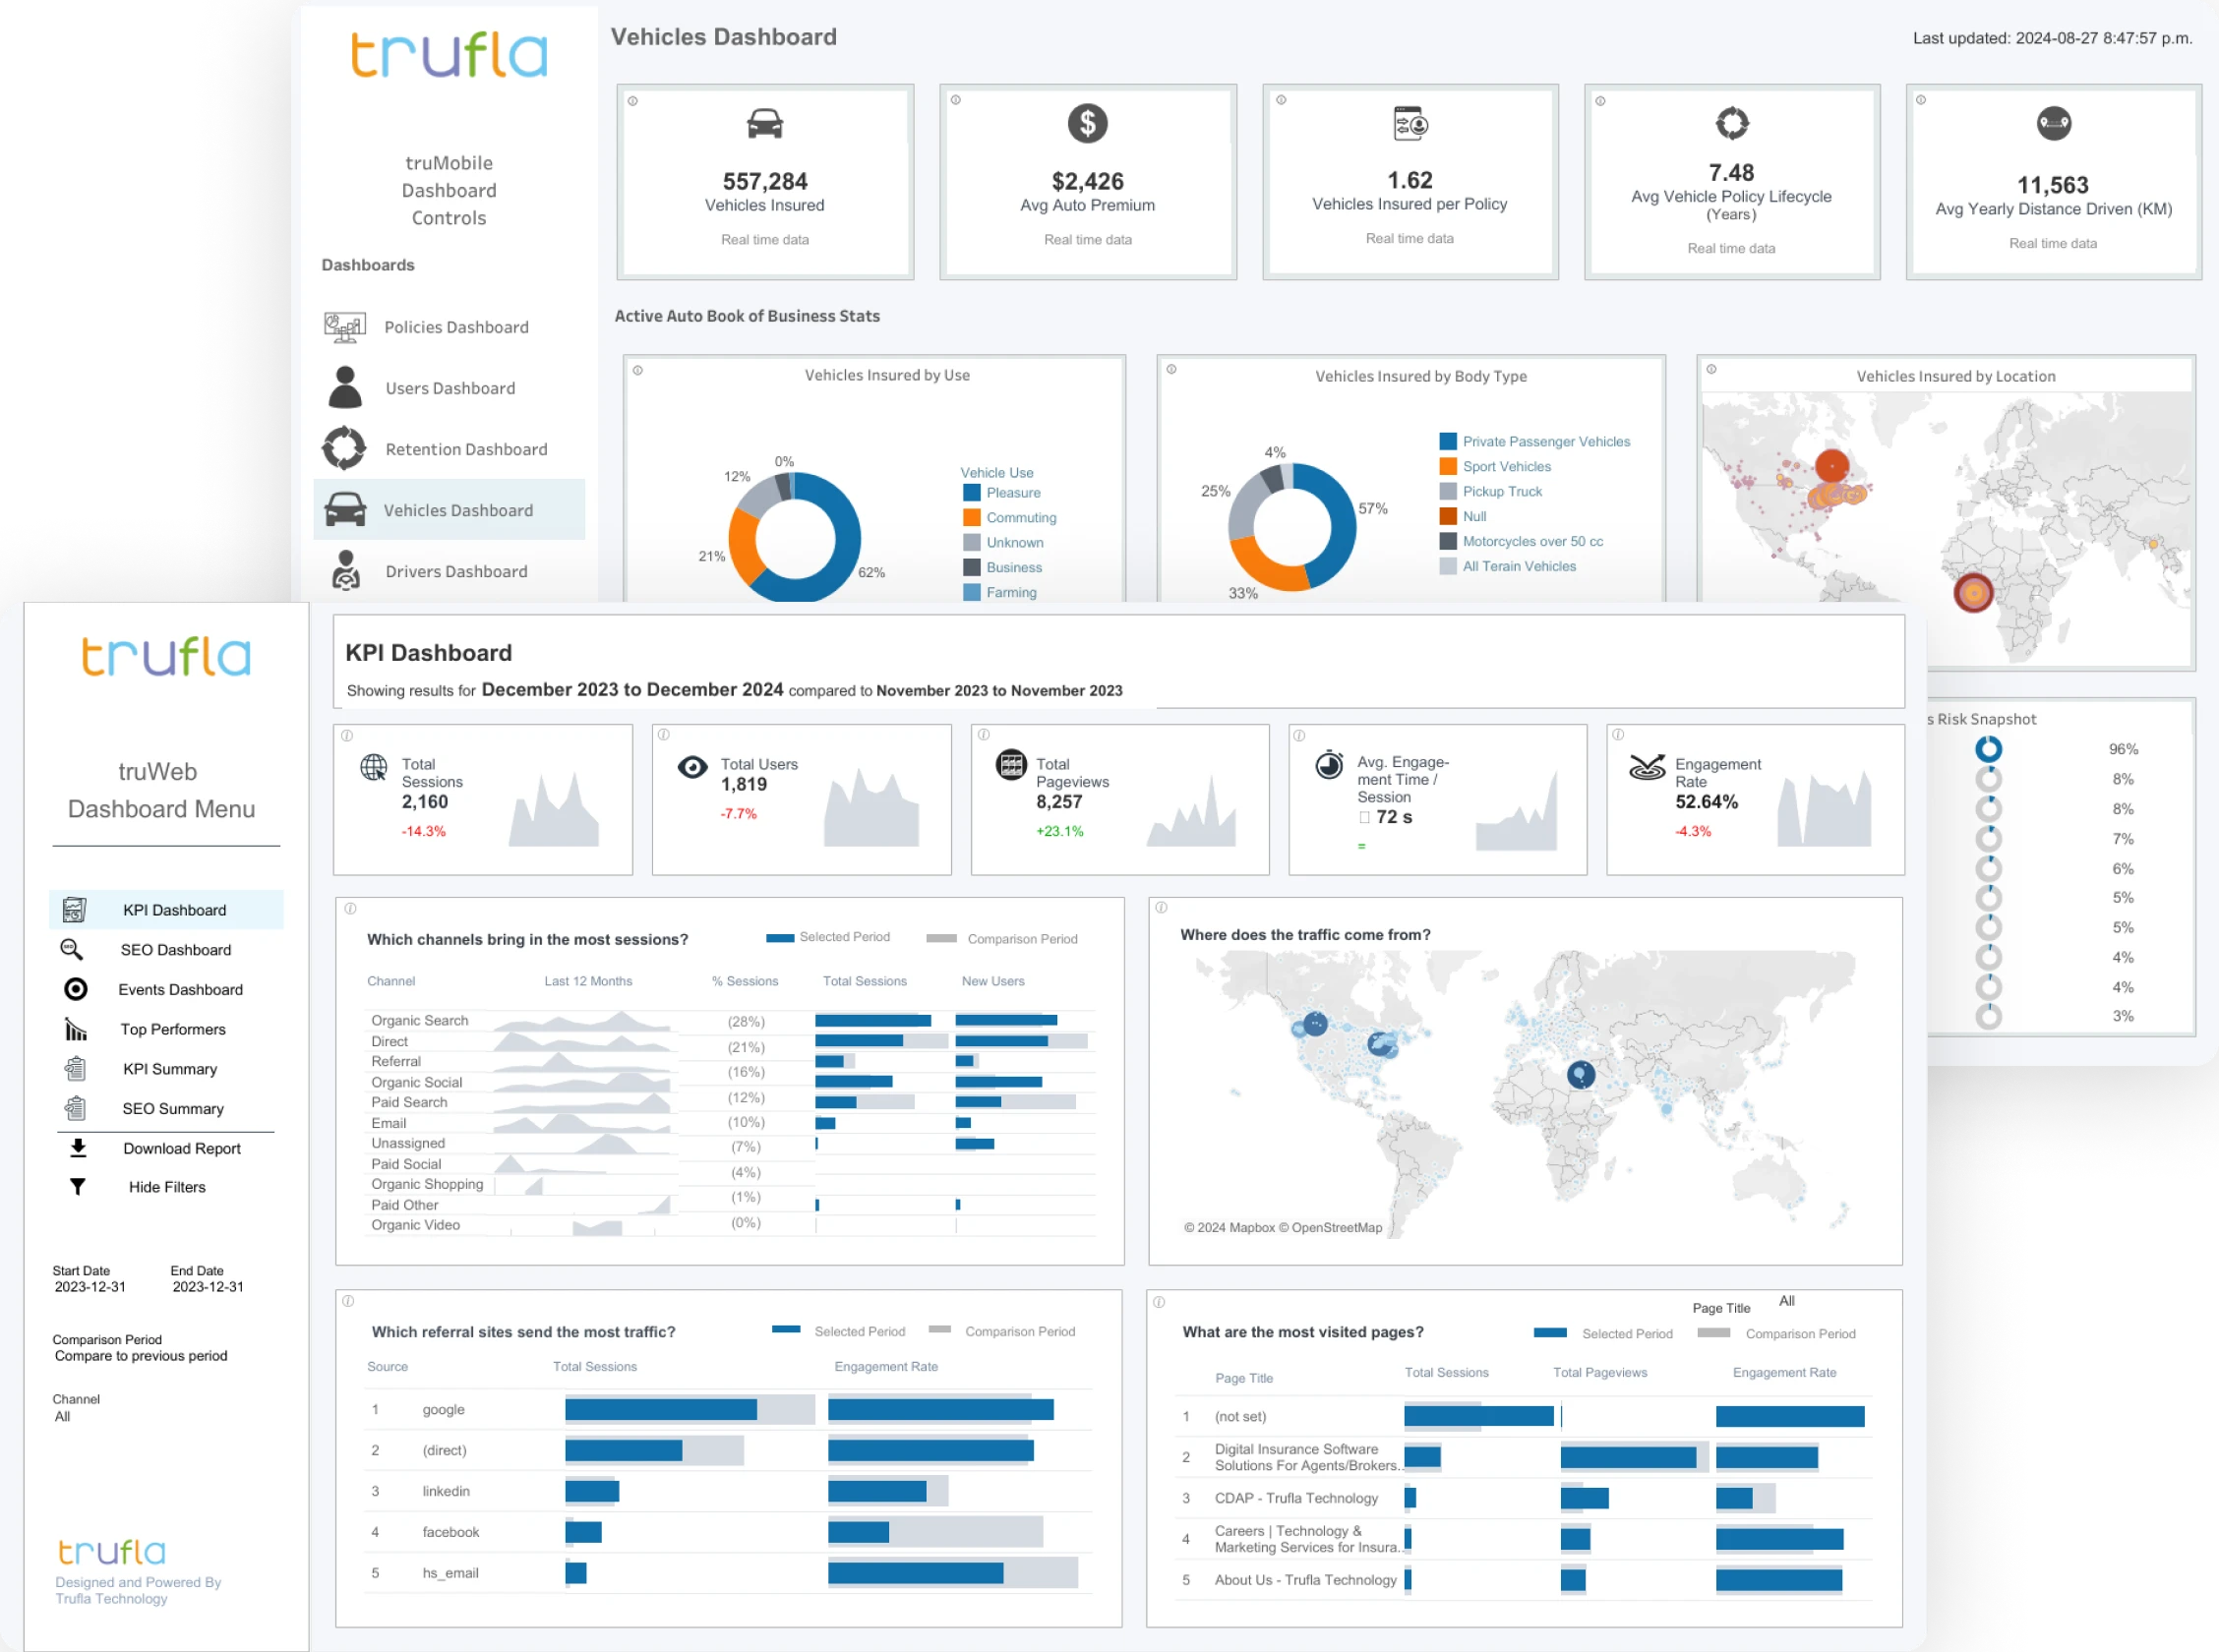
Trufla’s Policy KPI Dashboard provide brokers with powerful, real-time insights into their entire book of business. Offering 50% more data fields than traditional BMS systems, our dashboards give you a detailed view of your key metrics—from policy distribution to customer demographics—so you can make data-driven decisions that drive success.

Explore Our Dashboards

01

Policy Dashboard

Get a complete overview of your book of business with key metrics such as PIF (Policies in Force) count, policy distribution, insurer distribution, customer demographics, and retention rates. This dashboard offers a comprehensive picture of your brokerage’s performance, helping you stay on top of growth opportunities and emerging trends.

02

Users Dashboard

Designed specifically for truMobile customers, the Users Dashboard tracks customer engagement with key metrics like logins, number of requests submitted, claims activity, and more. Monitor how your customers are interacting with your mobile platform to improve user experience and service efficiency.

03

Retention Dashboard

Understand your retention performance with detailed breakdowns by line of business, insurer, and other key factors. This dashboard helps you identify trends in customer retention and take proactive measures to improve renewal rates and overall customer satisfaction.

04

Vehicles Dashboard

Take a deep dive into your auto book of business with the Vehicles Dashboard. Access aggregated data on premiums, insurer breakdowns, age demographics, vehicle types, and coverage details, enabling you to optimize your auto insurance portfolio and ensure competitive offerings.

05

Properties Dashboard

Analyze your property book of business across different types of coverage, including homeowners, condos, and renters. The Properties Dashboard offers insights into coverage breakdowns, insurer distribution, customer demographics, and regional trends, giving you the data you need to tailor your property insurance offerings.

06

Drivers Dashboard

Gain a complete demographic breakdown of the drivers in your book of business. From age and gender to driving experience and claim history, the Drivers Dashboard provides a detailed view of the people behind the policies, helping you create more personalized and effective insurance strategies.

Why Trufla Data Dashboards?

Enhanced Data Coverage

Access 50% more data fields than traditional systems, giving you a comprehensive view of your business.

Real-Time Analytics

Stay informed with real-time data that helps you make faster, more accurate decisions.

Actionable Insights

Turn complex data into easy-to-understand insights that you can act on immediately.

Tailored for Brokers

Our dashboards are built specifically for brokers, ensuring that the metrics you need are always at your fingertips.

Unlock the Power of Data Today

Let Trufla’s Data Dashboards transform the way you manage your book of business. From policies to properties, vehicles to drivers, we provide the insights you need to drive growth and improve efficiency.

Start Your Demo